 Coffee Space


I was recently looking for how the percentage of full-time vs part-time workers has changed over time, but couldn’t find any graphs to show it.
The reason for looking is that a friend told me a while back that Tescos is no longer hiring full-time staff, only part-time contracts. Another person similarly told me that they were trying to move their full-time contract onto a part-time contract.
My world view based on this was that the UK was generally shifting from full-time to part-time work. When it came to citing the data, it just wasn’t there. So, I decided to generate it.

I had to edit the data from the ONS as it was not in a good format, those changes can be found here
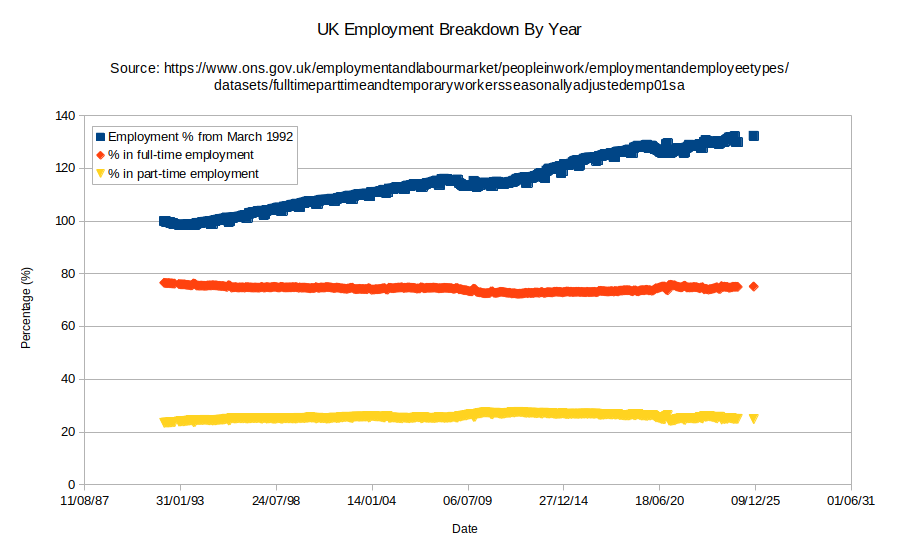
As you can see from the graph, my assumption that there was any real change in percentage of full-time or part-time work was wrong. It seems stable at an approximately 25:75 split of part-time to full-time work.
Maybe the most interesting point is that I know of many people currently looking for work, with multiple industries starting to fold, and yet this doesn’t appear reflected in the data (at least yet). I expect this picture to change very soon.
According to the ONS, (based on the assumption they actually know how many people are in the UK,) in 1992 there were 57,584,500 people, and in 2023 there were 68,265,200. The population is 118.5% of what it was in 1992, but the number of people in work is approximately 130%.
Put simply, given that the UK birth rate of native indigenous persons is so low, approximately half of all growth in that period is likely from migration into the UK. The UK economy has be stagnant for a very long time.
It’s worth noting that between 1997 and 2007 Tony Blair allowed complete and utter unchecked migration, but this has not allowed for a positive GDP per capita. Thanks Tony Blair.