 Coffee Space

I had a question somebody asked me: How many people actually read your site? That was a good question - am I just shouting into the void? So I have been tracking the site statistics for a while and wanted to share some data.
I should note, this wasn’t done through some tracking script and it’s not very robust. I simply check through the Nginx logs and analyse the data - nothing more complicated than this. Data is accumulated over time. Some flaws up front:
Regarding security, nothing else is going on. If you are concerned about your IP being searched, bare in mind that your ISP will keep track of IPs and their destination addresses, as well as much more intrusive data. Most websites keep some sort of access log, sorry. I need it to debug crashes, etc. The difference here is that I don’t run any advertising, I don’t sell your data and I don’t send your information to the government.
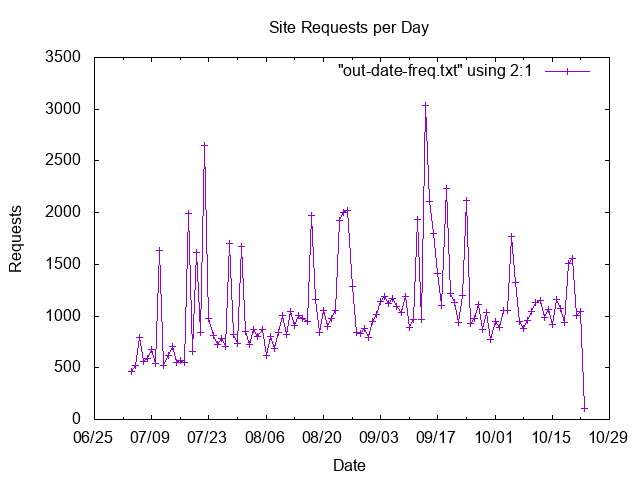
So far I have tracked 121,418 unique requests since the 18th July 2020 till today, 23rd October 2020. I haven’t tracked the error log as this was a trial.

As you can see, I have slowly crept from about 500 requests per day to about 1,000 requests per day (double) in about 3 months. This is zero search engine optimization (SEO), zero advertising and little up-keep. Hell, it only supports HTTPS because it has to.
Where are the requests coming from?

It seems they are mostly coming from the United States, followed next by Singapore, China, Netherlands, France, Germany and New Zealand. I have no idea why these particular Countries, but it’s an interesting breakdown given I don’t have many friends in the US I’ve given my site details to! Organic growth perhaps?
In 2017 I did a little experiment to figure out who was attacking a server I was running based in Russia - which looks greatly different from these logs. China featured massively in those.
So going forwards I want to start tracking a few more things: