 Coffee Space

NOTE: This article is copied from my GitHub repository.
This is a quick and dirty article on trying to detect news bias in news media on the 2017 UK elections using sentiment analysis (TextBlob 0.12.0) and it’s default training package. The reason for this is that there have been various claims of bias that the main-stream news media have been biased in the reporting up to the election [1] [2]. In the study concentrated on here [2], they fail to analyse the opposite side, allowing them to draw any conclusions they want using their Content Analysis.
The data was sourced by using the DuckDuckGo search engine because
they have their “do not track” policy, which I thought would make the
searching much better. I did originally look at trying to get news from
RSS feeds, but it seemed as if I would actually have to collect data for
several months in order for that to work. I used the following search
terms, “Theresa May politics” and “Jeremy Corbyn politics”, get the
results which were simply copied and pasted into a gvim. I
then proceeded to clean the data by just keeping the abstract of the
news article.
As you can see, we get a nice spread of news articles, although one
down side is that there really isn’t much text to analyse. It’s hoped
that the opening sentence/s are representative on average of the content
of the article to follow. All data used is stored in the
dat/ directory of this repository.
There were two, then there were one…
I apologise in advance to any hard core Python enthusiasts - I don’t really like Python, but it’s the quickest language I could think of to hack this kind of thing together. Hopefully you find the code still readable.
So this was meant to be a quick and dirty hack to get some results of of the data, but didn’t end up yielding any results. When it did work, it didn’t really flag up any really interesting results and hinted that sentiment analysis is actually something that is tougher than I previously thought.
I left the code in anyway for completeness, maybe somebody can get it working or something.
I decided to use TextBlob for the sentiment analysis, as it really is a simple to us implementation [3]. A lot of the others I was looking at required training before I could get anything working and in reality, what I was looking for was a “near-enough” solution.
Firstly, you must install TextBlob and it’s packages:
0001 pip install -U textblob
0002 python -m textblob.download_corpora
Be sure to read more of their installation instructions if you get stuck [4].
You should now simply be able to run the bash script
run.sh at the top of the directory to produce these results
- I wanted to make it as simple as possible for other people to be able
to replicate my experiment.
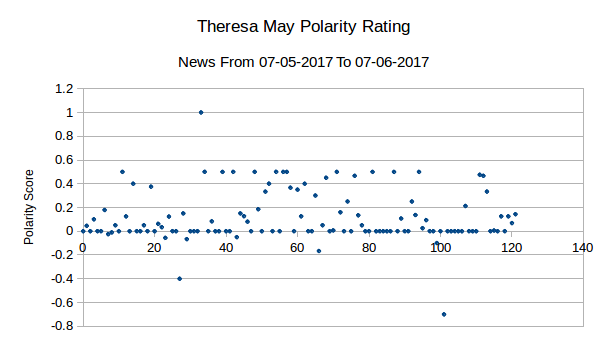
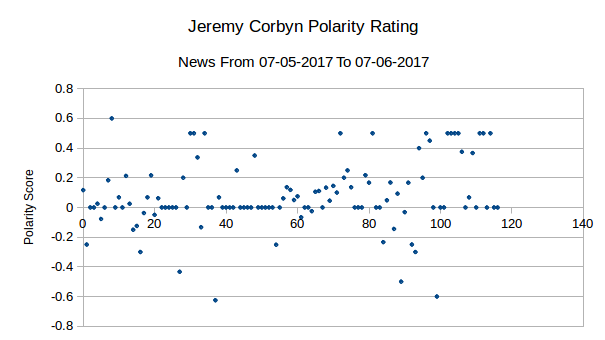
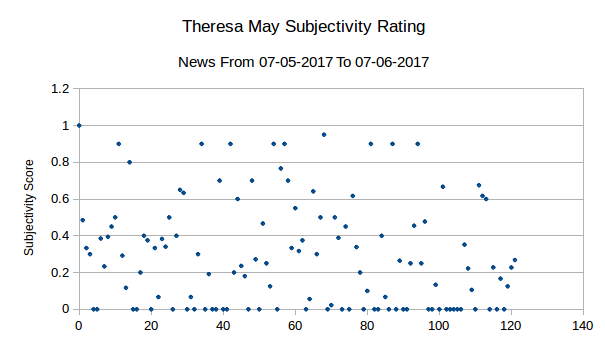
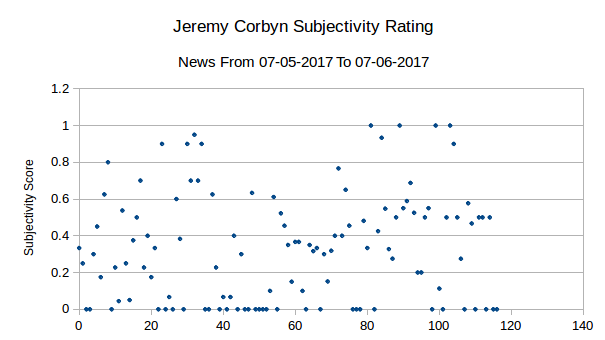
Below are the raw results - we will discuss what they mean in the conclusion.


Firstly, the standard deviation shows the data is pretty well matched in terms of distribution, a statement backed visually by the graphs themselves. It’s fair to say that there isn’t the clearest distribution of data here, but equally it is not the worst correlation possible.
The subjectivity rating in the article abstracts seem to be quite evenly distributed, both with ratings approximately 0.3.
The polarity score on the other hand is quite, with May’s rating edging out at ~0.12 and Corbyn lower at 0.08. We’re splitting though and these are not substantially different enough to be a cause for concern.
I would say that the claim made my LSE, that Corbyn has been unfairly represented in the main-stream media is uninstantiated, at least from these results seen here. A more detailed analysis could certainly be warranted, but from at least the summary presented here, there shouldn’t be a stark difference across a random selection of media. It is likely, however, that individual news-outlets will introduce their own bias, but this is the reason why their readers buy their papers in the first place.
[1] The Independent
[2] London School of Economics and Political Science
[3] TextBlob
[4] TextBlob